The plugin is quite easy to use. Once you have setup your SonarQube servers, you just need to use the SonarQube Connector Macro to setup the resource you want to get metrics from.
You have to complete two parameters:
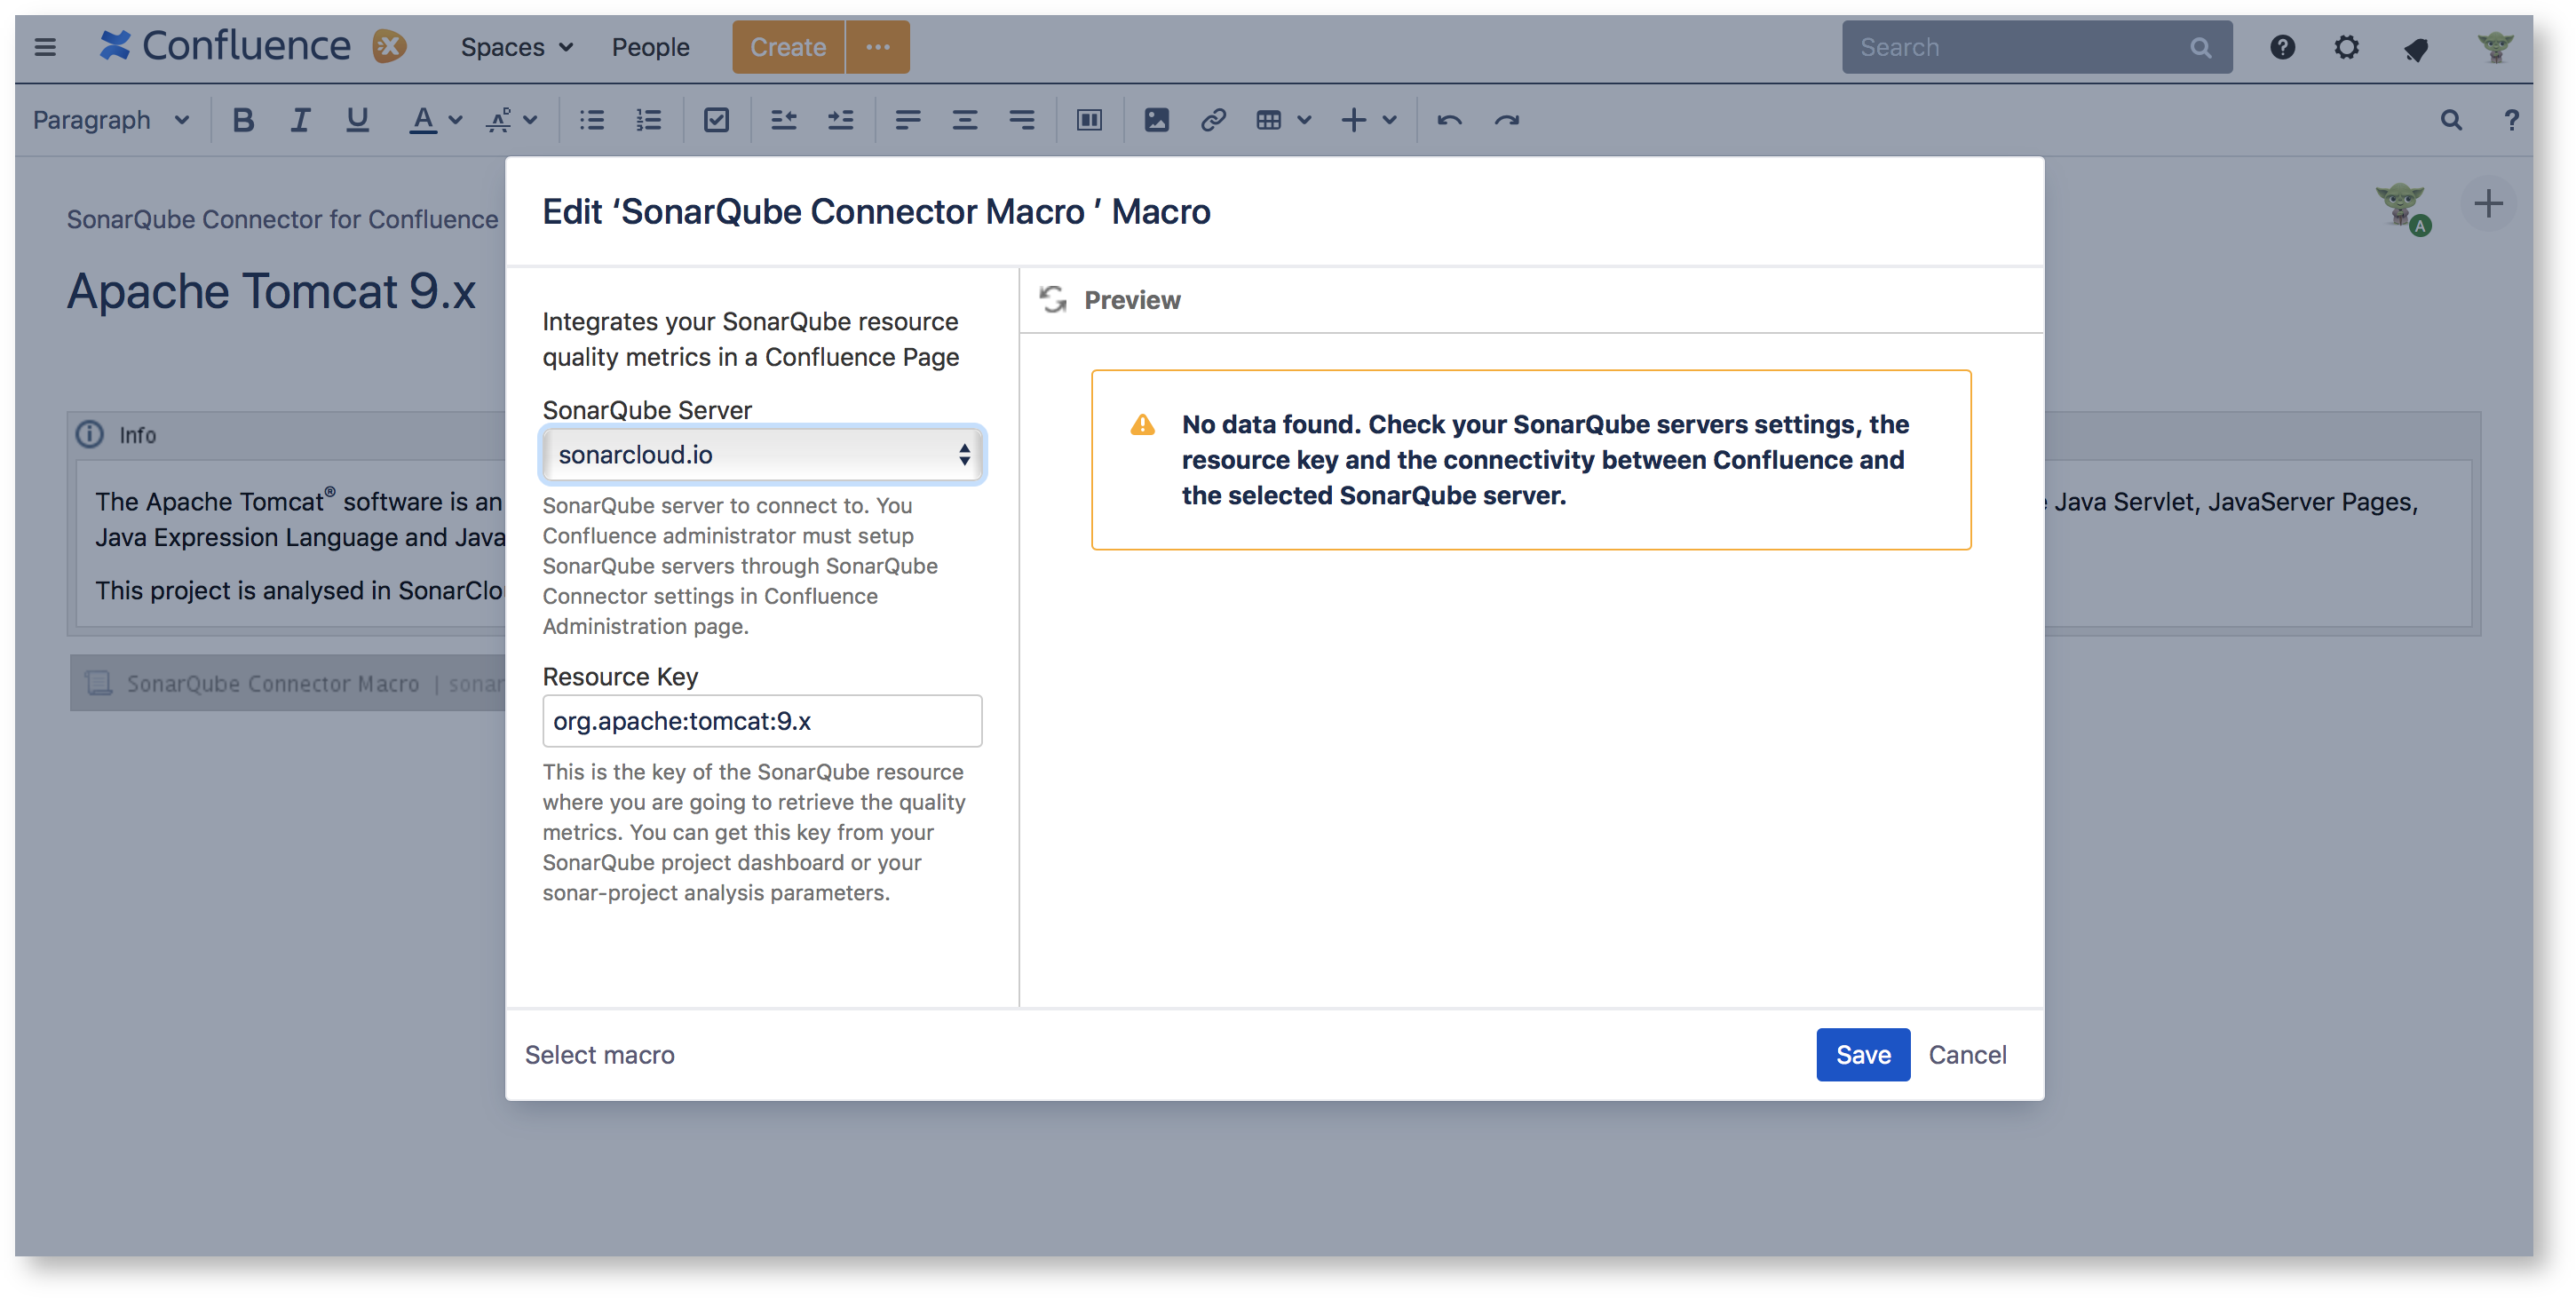
- SonarQube server: this is a dropdown list with the SonarQube servers configured through the plugin settings.
- Resource Key: this is the key of the SonarQube resource to retrieve the quality metrics. You can get this key from your SonarQube project dashboard or your sonar-project analysis parameters.
- Note: Enterprise portfolio are also supported you can enter the portfolio name here.
- Tags :This is an optional field. You can get the projects through the tags associated with them in SonarQube/SonarCloud. These tags can be obtained from your project page in SonarQube/SonarCloud or from the analysis properties. You can configure more than one tag by specifying a comma separated list of tags. The results will be aggregated in a single view with all the resources together.
- Custom metrics: List of custom metric keys to display in the page, you can specify one metric key or a list of metric keys separated by commas. For example: blocker_violations, major_violations, classes. Check with your SonarQube administrator to find out the keys to the available metrics
- Branch: Name of the branch (visible in the SonarQube UI)
- Only available on single project configuration
Setting multiple resource keys
Since 1.2 version you can setup multiple SonarQube projects in SonarQube Connector macro settings.
You just have to provide a comma separated list of project keys instead of only one. Note that if the list if too big then the page will take long to display.
This is very useful if your team manages several software components and you want to have all of them in your Confluence page.
SonarQube Connector for Confluence will aggregate all the metrics into a single view.
This new view provides:
- A header section with all the collected metrics and global ratings. This includes the project distribution for each rating (size, reliability, security and maintainability) and the aggregated measures.
- A project portfolio section with the information for each project, including last analysis date and quality gate.

How do we compute the global ratings?
If you configure multiple projects then you will get a global rating for the main quality metrics: size, reliability, security and maintainability:
- Size rating: this is the sum of all lines of code of all the projects. The rating is computed exactly the same as a individual project. See Size Rating for more information.
- Reliability, Security and Maintainability rating: these ratings are computed by giving values from 1 to 5 to each project depending on the rating (A=1 ... E=5). Then we sum all the values and compute the average number. This number is rounded to the nearest value from 1 to 5. This value will be the global rating for your projects.
