GADGET CONFIGURATION
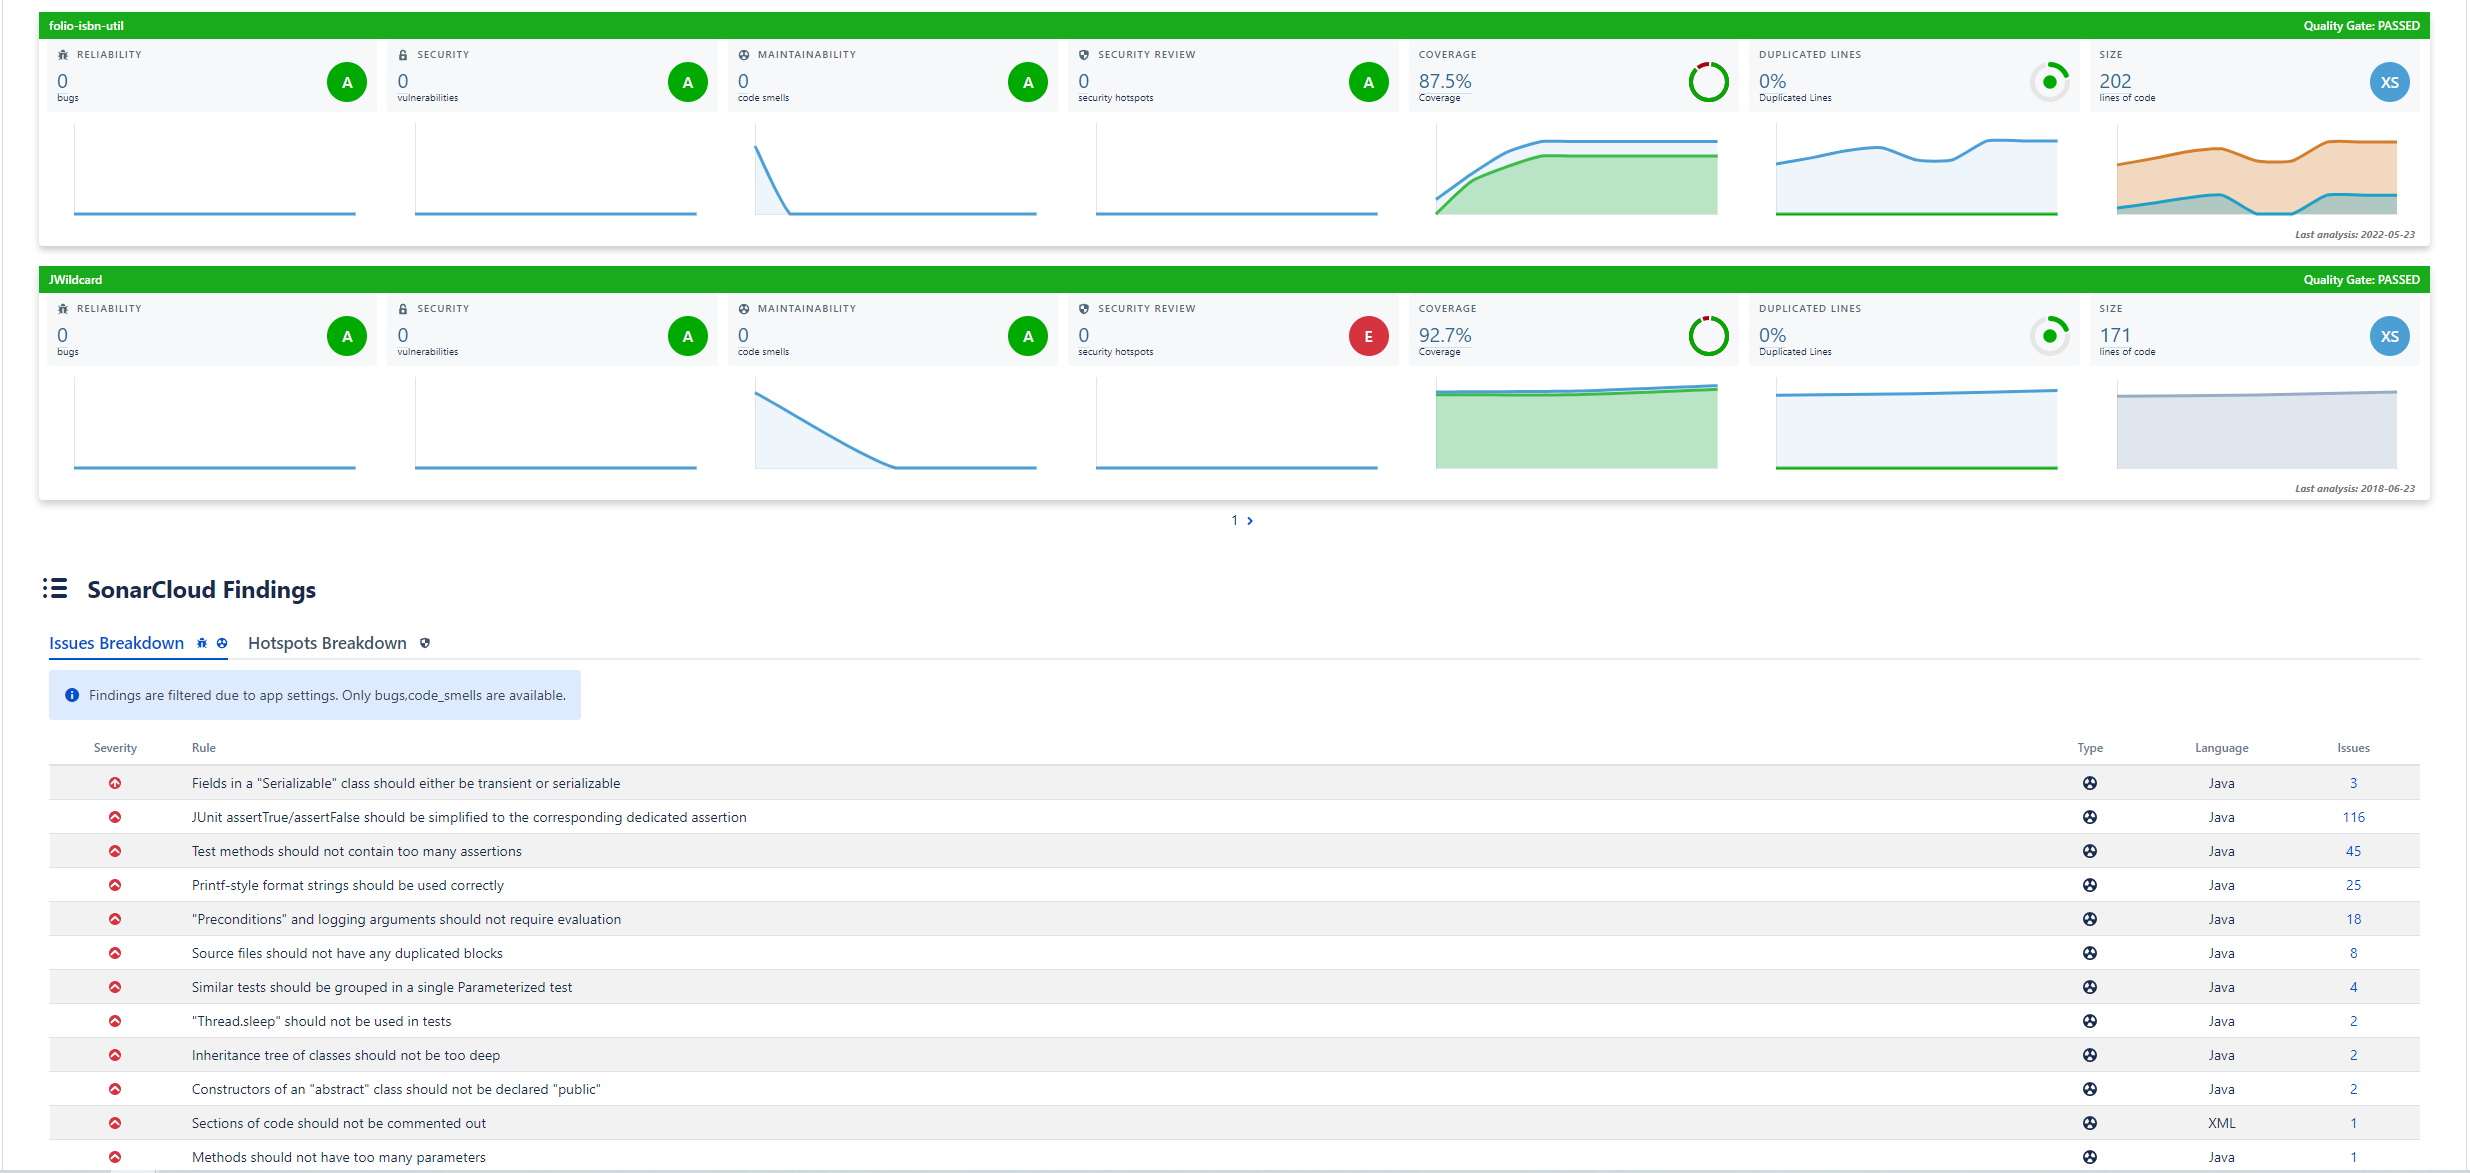
Since 1.9 version you can view the SonarQube issues associated with a project or several from a gadget.


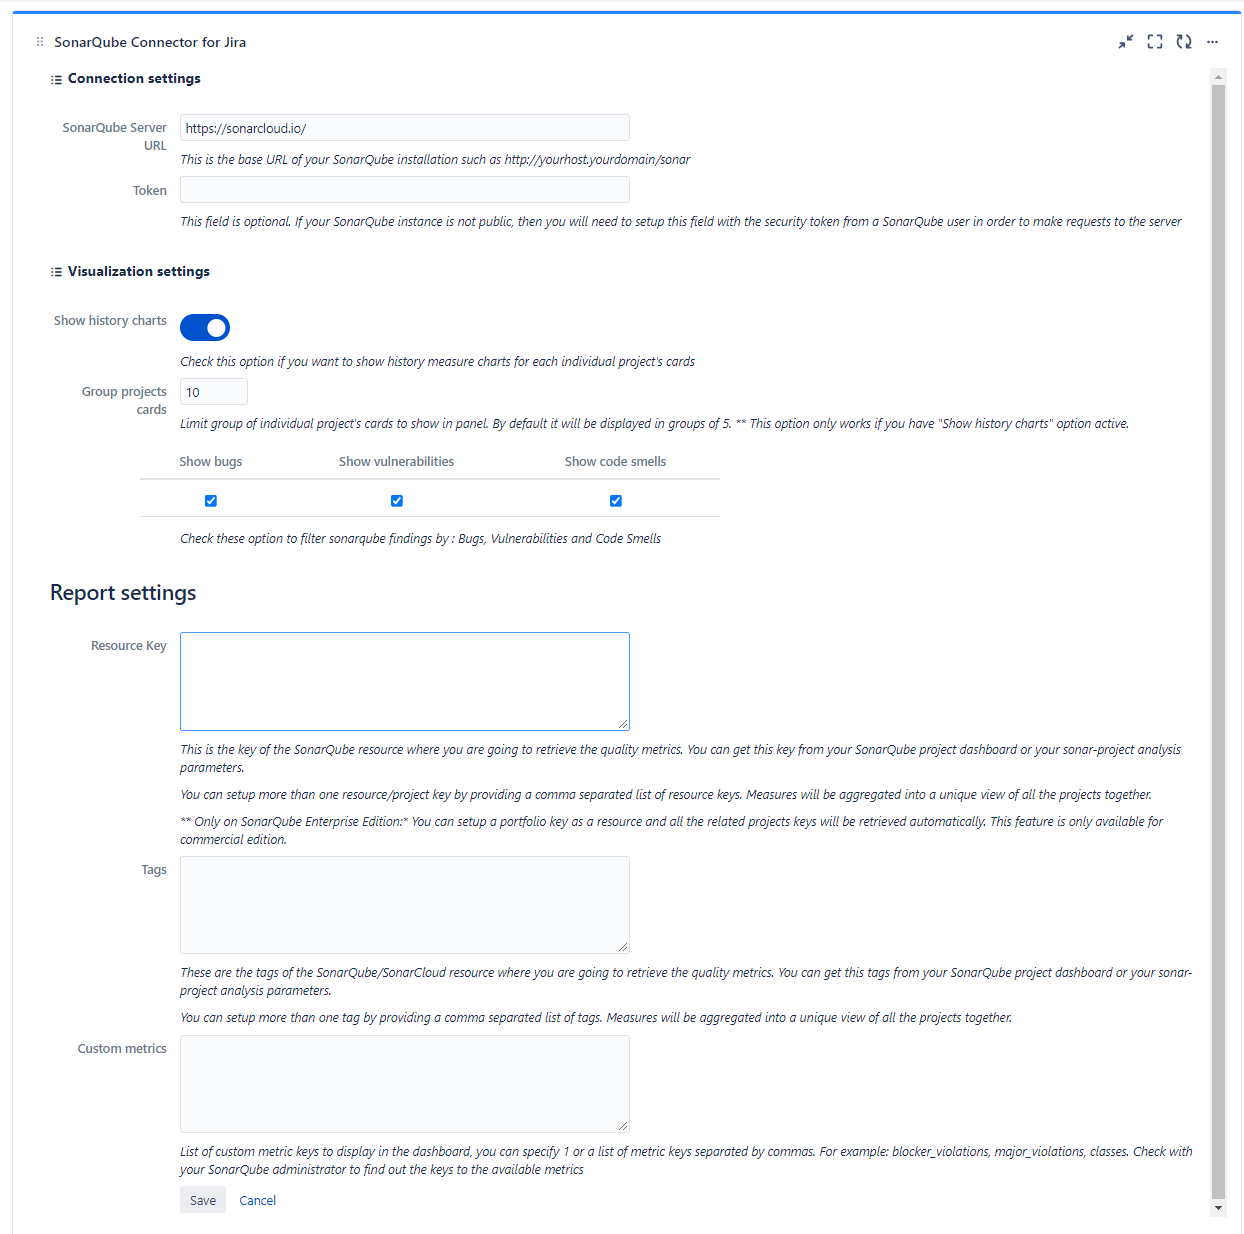
Connection settings:
- SonarQube Server URL: this is server base URL for your SonarQube Cloud installation
- Note : the base URL for SonarQube Cloud is https://sonarcloud.io
- Token: this field is optional. If your SonarQube cloud instance is not public, then you will need to setup this field with the security token from a SonarQube user. You can find more information about SonarQube tokens here: https://docs.sonarqube.org/display/SONAR/User+Token
Visualization settings:
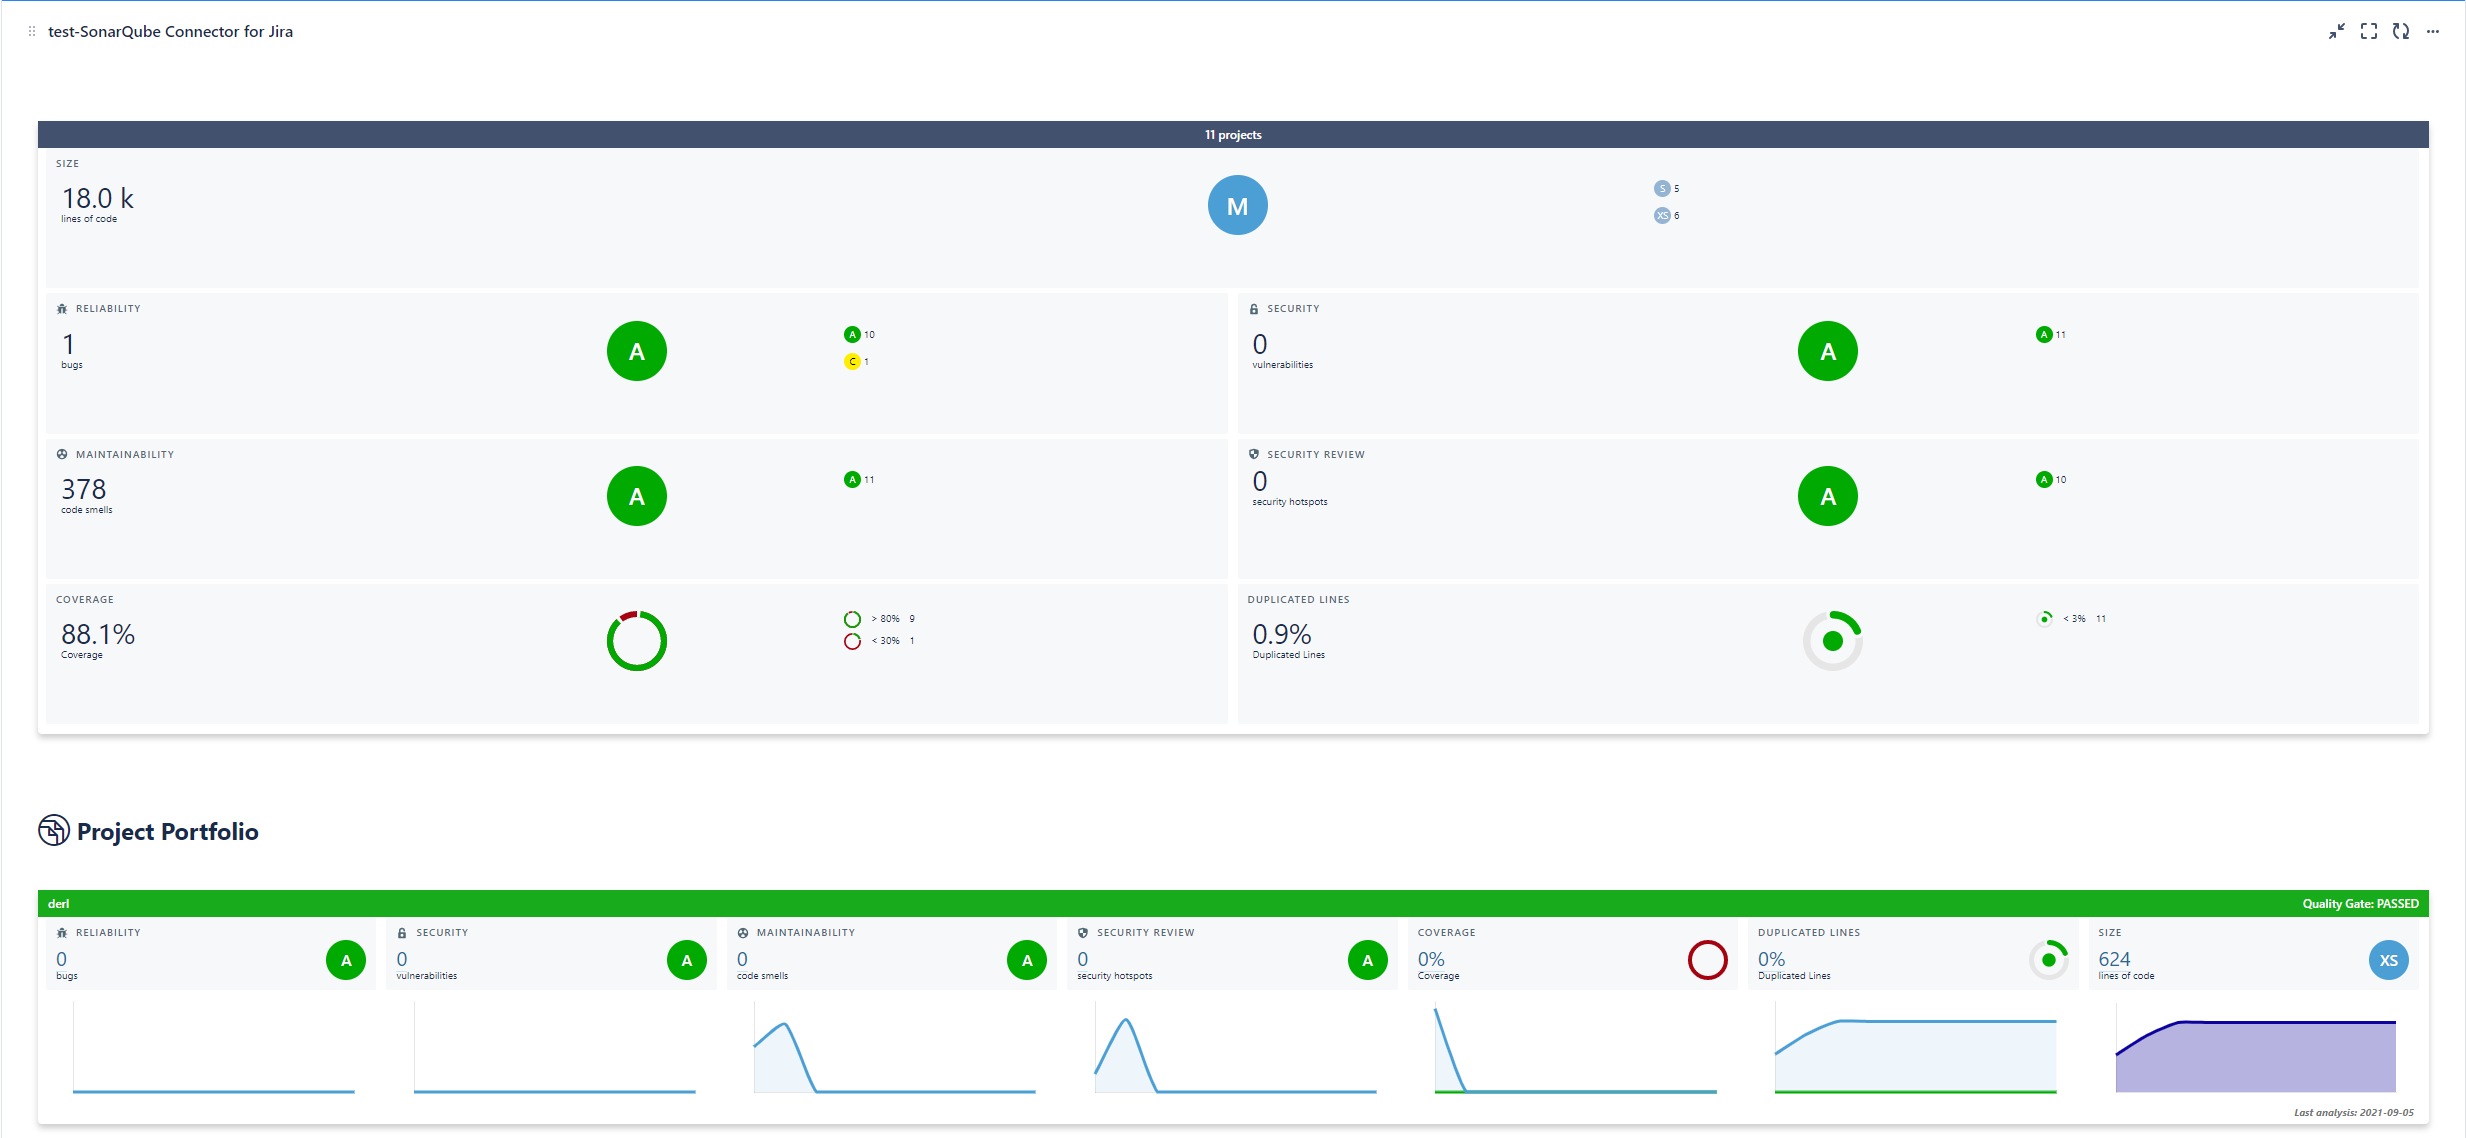
- Show history charts : Check this option if you want to display measures history charts for each sonarqube project in Sonarqube Connector Panel Report.
- Group project's cards : Select this option to set number of project cards per page that will be displayed in Sonarqube Connector Panel Report.
- Show bugs, vulnerabilities or code smells : Check these options if you want to filter sonarqube findings by Bugs, Vulnerabilities or Code Smells.
Report settings:
- Resource ID: this is the key of the SonarQube resource where you are going to retrieve the quality metrics. You can get this key from your SonarQube project dashboard or your sonar-project analysis parameters.
- Note: since version 1.4 you can setup more than one resource/project key by providing a comma separated list of resource keys. Measures will be aggregated into a unique view of all the projects together. See section linking multiple projects to Jira.
- Tags :This is an optional field. You can get the projects through the tags associated with them in SonarQube/SonarCloud. These tags can be obtained from your project page in SonarQube/SonarCloud or from the analysis properties. You can configure more than one tag by specifying a comma separated list of tags. The results will be aggregated in a single view with all the resources together.
- Issue type: This is the default issue type to create new SonarQube issues
- Custom metrics: List of custom metric keys to display in the dashboard, you can specify 1 or a list of metric keys separated by commas. For example: blocker_violations, major_violations, classes. Check with your SonarQube administrator to find out the keys to the available metrics
- SonarQube Server URL: this is server base URL for your SonarQube Cloud installation